Monitoring a production Hadoop cluster with Kubernetes
Dec 21, 2018
Never miss our publications about Open Source, big data and distributed systems, low frequency of one email every two months.
Monitoring a production grade Hadoop cluster is a real challenge and needs to be constantly evolving. The software we use today is based on Nagios. Very efficient when it comes to the simplest surveillance, it is not able to meet the need for a more complex verification.
In this article, we will propose an architecture using Kubernetes that we wish to develop. This project is still an in progress work and would evolve in the next months. First we will analyze the needs and the limits of our current infrastructure. Next we will see how a Kubernetes architecture can help us. Finally we will suggest a way to deploy this architecture.
Monitoring a Hadoop cluster is not a piece of cake
Our need can be simply defined as: we have to ensure that every type of connection to our clusters are working correctly with an acceptable response time.
It is not an easy task. For example in order to read a value in an Hbase table, applications can use:
- Java connection using Thrift
- HTTP connection using Hbase Rest
- HTTP connection using Knox Gateway
- JDBC connection using Phoenix
These calls can come from Spark Application, YARN job, or from a completely external source. Each use authentication trough Kerberos or LDAP.
When it comes to troubleshooting, the objective is always to reproduce the issue whether it’s an error or a task that takes too long. It consists of sending a request to the service, execute a command through a CLI (Beeline, HBase shell…) or to launch a small application on YARN… Each time we would like to schedule this check and be warned when it fails.
Currently our monitoring is based on Shinken, a fork of Nagios. It was installed in order to monitor and restart Hadoop services. Some smarter tests have been added over the years. Some of them mimic an application connecting to the cluster. Shinken is not meant to solve this use case. Instability ensues, so the tool could no longer be our trusted main source of monitoring.
Kubernetes
Tests orchestrated by Shinken are run from inside a Docker container. That way it’s easy to deploy the scripts and their environment (e.g. Python or NodeJS). Following this logic we can execute every test inside a container. The container image will only contain the script code and its dependencies.
The next steps consist of scheduling these verification tests, obtain their results, visualize them and be warned in case of issues. Kubernetes is quite a logical choice for this use case. K8s will make available our infrastructure to execute containers periodically. It is also highly requested to monitor response time, measure SLA and publish dashboards. Shinken does not meet this need.
Writing an image
Writing the Docker image should be very simple in order to write a new test in no time. To do this the interface between our script and the architecture should be very light.
We identify three ways of doing this:
- Write a serialized object to
stdout - Write a serialized object to a defined port
- Write a serialized object in a file
We do not want to directly write to a Database. Indeed, it would imply to integrate a complex logic in our image and we will lose a large part of our flexibility. The first interface is the simplest but may be too limited. The two others add a logic to test: more complex but not insurmountable. It will probably require some trials and error to get the best results.
Read the result
Once the test has been executed we wish to read and store the result. We therefore need to attach to the container without disrupting its execution.
Two architectures are available:
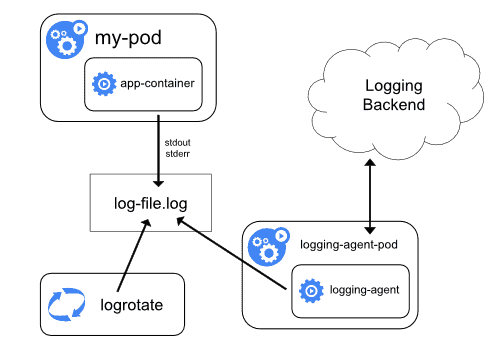
Node-level logging agent
On each node of the Kubernetes cluster, a logging agent runs separately from other containers. The agent is dedicated to read logs of all the other containers and send them to a data store. It’s the only container that is aware of the data storage and have write access to it. It’s also possible to run multiple logging-agent on a node, each connected to a separate database to manage multiple use cases.
However, this only works for stdout and stderr. Depending on the application it could be insufficient. For more complex application it is recommended to use a sidecar container.
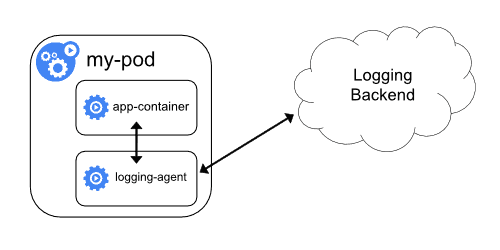
Sidecar container
A sidecar container is a container executing in the same pod as our script. Since it shares the same network space and the physical node it is easy to communicate between the two containers (trough localhost or local volumes mount). It is a bit more complex than node-level logging agent but much more flexible when it comes to variety of sources.
Providing metrics
These results need to be made available for consulting.
The simple way to do it is to store them in a data store such as Elasticsearch or Prometheus. Such database can be simply read by a visualization tool like Grafana. Dashboards and alerting can then be made on this data.
Summary
Let’s summarize what we will need to build this project:
- Docker images containing a script and its dependencies which will test a component
- A Kubernetes cluster able to run this container periodically and store configurations
- Logging agent which will fetch test results and store in at least one database
- Database storing history. They will be used to consult and alert on the state of the cluster

