Logstash pipelines remote configuration and self-indexing

Dec 13, 2019
- Categories
- Data Engineering
- Infrastructure
- Tags
- Docker
- Elasticsearch
- Kibana
- Logstash
- Log4j [more][less]
Never miss our publications about Open Source, big data and distributed systems, low frequency of one email every two months.
Logstash is a powerful data collection engine that integrates in the Elastic Stack (Elasticsearch - Logstash - Kibana). The goal of this article is to show you how to deploy a fully managed Logstash cluster incuding access to the logs and remotely configurable pipelines.
Previously the Elastic stack had two issues when it comes to a fully managed service: Kibana did not support Elasticsearch High Availabilty and Logstash Pipelines were not configurable remotely.
Theses two problems are resolved since ELK 6, Kibana now supports multiple hosts (and can autodiscover new hosts) and logstash pipelines can be modified directly on Kibana using Centralized Pipeline Management.
Configure Centralized Pipeline management
Centralized Pipeline Management is available since ELK 6.0 and requires a valid Elasticsearch Gold or Platinium License. If you do not have one, don’t worry! You won’t be able to modify the pipelines on Kibana but the rest of the blog post will still be relevant.
How Pipeline management works is simple: pipelines configuration are stored on Elasticsearch under the .logstash index. A user having write access to this index can configure pipelines through a GUI on Kibana (under Settings -> Logstash -> Pipeline Management)
On the Logstash instances, you will set which pipelines are to be managed remotely. Logstash will then regularly check for changes and apply them. Local configuration for this pipeline will not apply once remote management is set.
Here is a snippet of what the logstash.yml looks like:
...
xpack:
  management:
    enabled: true
    elasticsearch:
      hosts:
        - 'host1.mydomain:9200'
        - 'host2.mydomain:9200'
        - 'host3.mydomain:9200'
      username: logstash_admin_user
      password: MySecretPassword
      ssl:
        certificate_authority: /usr/share/logstash/config/certs/cacert.pem
    pipeline:
      id:
        - logstash_logs
        - client_pipeline1
        - client_pipeline2
If you deliver this to a client on a secured environment, you need to establish with your client:
- How many pipelines are needed, since adding a pipeline is a administrator operation and requires restarting the Logstash instances.
- If the pipelines are listening to connections (listening for Filebeat content for example) you will need to open the ports where the client can listen to.
- If you are using SSL using your own certificate authorities, do not forget to make the CACert readable by the Logstash process.
Tips and tricks:
- Create the pipeline on Kibana before starting your Logstash instance! If the pipeline is not created Logstash will not boot up correctly. Just the default empty pipeline will do the trick.
logstash_admin_userneeds the following rights:- CRUD on
.logstash*index (available in the defaultlogstash_adminrole) - Cluster privileges:
manage_index_templates,monitor,manage_ilm
- CRUD on
Provide access to Logstash logs on Kibana
The modification on the pipeline definition are applied on your Logstash instances, great! But the user complains that his pipelines are not working and want access to Logstash logs to see why. As the administrator you don’t want the user to access directly the logs on the machine. Why not use the Elasticsearch cluster to index the Logstashs logs? Let’s see how to do it!
Make Logstash write to files (on Docker)
Logstash uses log4j2 to manage its logging. The default log4j2.properties is available on the Logstash GitHub repo. Be aware that a much simplified log4j2.properties is shipped inside the official Docker image. This simplified version will only write standard logs to stdout.
What we want to achieve here is:
- write logs to a file
- Rollover this file based on date and/or size
- Make this file available on the host machine (when using Docker)
The default log4j2.properties will manage the rollover, but will also writes to stdout.
Disable logging to stdout
I would not recommend logging to the console where you could use files instead. Especially on Docker it will probably end up filling a filesystem you’re not in control of.
To disable logging to the console, comment these two lines in your log4j2.properties (if using the default one). You will be able to dynamically reenable it using the Logstash API.
#rootLogger.appenderRef.console.ref = ${sys:ls.log.format}_console
#logger.slowlog.appenderRef.console_slowlog.ref = ${sys:ls.log.format}_console_slowlog
Set the log path and the log format
I recommend using the PLAIN format and not the JSON one. It is much easier to read and not that hard to parse. Place these properties in your logstash.yml
path.logs: /usr/share/logstash/logs
log.format: plain
(Docker only) Create a Logstash user on the host machine
Since we want our Logstash containers to be able to write on our host machine, we must create an user with write permissions on our log directory. The user need to have the same UID both in the container and on the host machine. By default the “logstash” user in the container got UID 1000 who will often be associated to “root” which is not something you want to do.
# On the host machine
groupadd -g 1010 logstash
useradd -u 1010 -c "Logstash User" -d /var/lib/logstash -g logstash logstash
mkdir /var/logs/logstash/mycluster/logstash_logs
chown -R logstash:logstash /var/logs/logstash/mycluster/logstash_logs
We just created a “logstash” group with a specified GID (1010), a “logstash” user with a specified UID (1010) and placed it in its group. We also created a directory where the Logstash container can write to.
(Docker only) Change the User and UID in the Logstash container
We need to modify a little bit our Docker image to reflect our newly created “logstash” user. This Dockerfile works using Logstash version 7.3.
FROM logstash:7.3.1
USER root
RUN groupmod -g 1010 logstash && usermod -u 1010 -g 1010 logstash && chown -R logstash /usr/share/logstash && \
    sed -i -e 's/--userspec=1000/--userspec=1010/g' \
      -e 's/UID 1000/UID 1010/' \
      -e 's/chown -R 1000/chown -R 1010/' /usr/local/bin/docker-entrypoint && chown logstash /usr/local/bin/docker-entrypoint
USER logstash
To build the image: docker build --rm -f Dockerfile -t logstash-set-user:7.3.1 .
We will then need to use the image logstash-set-user:7.3.1 instead of the default one.
(Docker only) Manage your mounting points in your docker-compose file
When using a compose file to deploy your Logstash, you can declare:
...
services:
  logstash:
    user: logstash
    volumes:
      - '/etc/elasticsearch/mycluster/logstash/conf/logstash.yml:/usr/share/logstash/config/logstash.yml'
      - '/etc/elasticsearch/mycluster/logstash/conf/log4j2.properties:/usr/share/logstash/config/log4j2.properties'
      - '/var/log/elk/mycluster/logstash:/usr/share/logstash/logs'
    image: 'logstash-set-user:7.3.1'
Add a pipeline that gathers logs and sent them to Elasticsearch
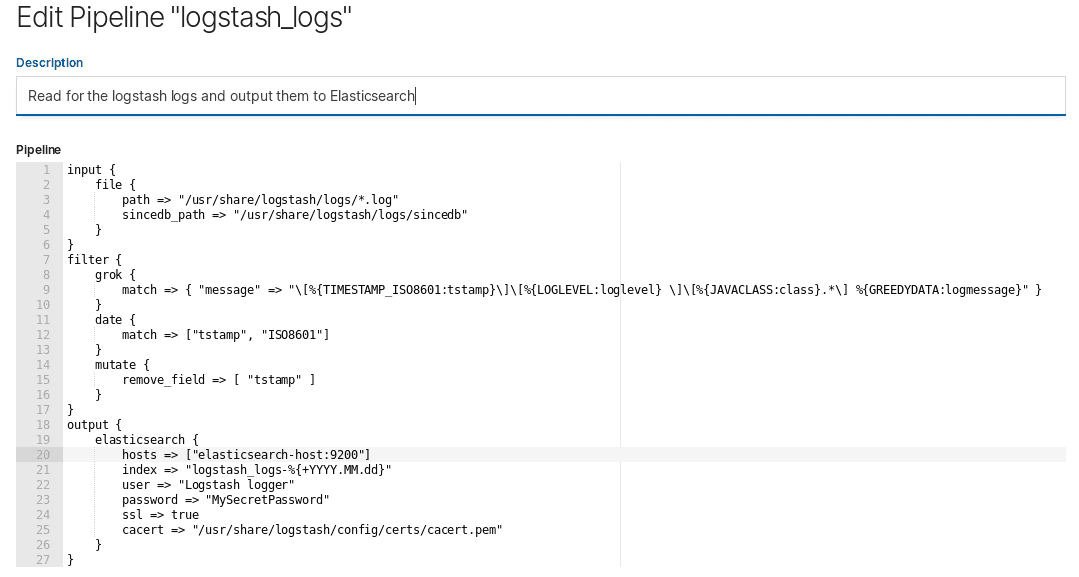
The Pipeline definition that I use for this purpose is this one:
input {
    file {
        path => "/usr/share/logstash/logs/*.log"
        sincedb_path => "/usr/share/logstash/logs/sincedb"
    }
}

filter {
    grok {
        match => { "message" => "\[%{TIMESTAMP_ISO8601:tstamp}\]\[%{LOGLEVEL:loglevel} \]\[%{JAVACLASS:class}.*\] %{GREEDYDATA:logmessage}" }
    }
    date {
        match => ["tstamp", "ISO8601"]
    }
    mutate {
        remove_field => [ "tstamp" ]
    }
}

output {
    elasticsearch {
        hosts => ["host1.mydomain:9200", "host2.mydomain:9200", "host3.mydomain:9200"]
        index => "logstash_logs-%{+YYYY.MM.dd}"
        user => "logstash_logs_user"
        password => "MySecretPassword"
        ssl => true
        cacert => "/usr/share/logstash/config/certs/cacert.pem"
    }
}
It is very simple: it checks for files in my log directory. When it finds one, it parse the content a little bit to extract the timestamp, the log level, the class and the message. It also replace the timestamp with the one available in the logs (if not set, Logstash would use the timestamp of the current time when reading the log). These logs are then sent to the Elasticsearch cluster in the logstash_logs-(+ date) index.
A few notes:
- You can also use Filebeat for this purpose. I did not because it would require adding even more containers. The user is also able to disable the pipeline (just comment the input section).
- My grok filter is not perfect, it does not manage multilines logging but fits my needs.
- If you do not have an X-Pack license, you can still use this pipeline except you won’t be able to configure it on Kibana
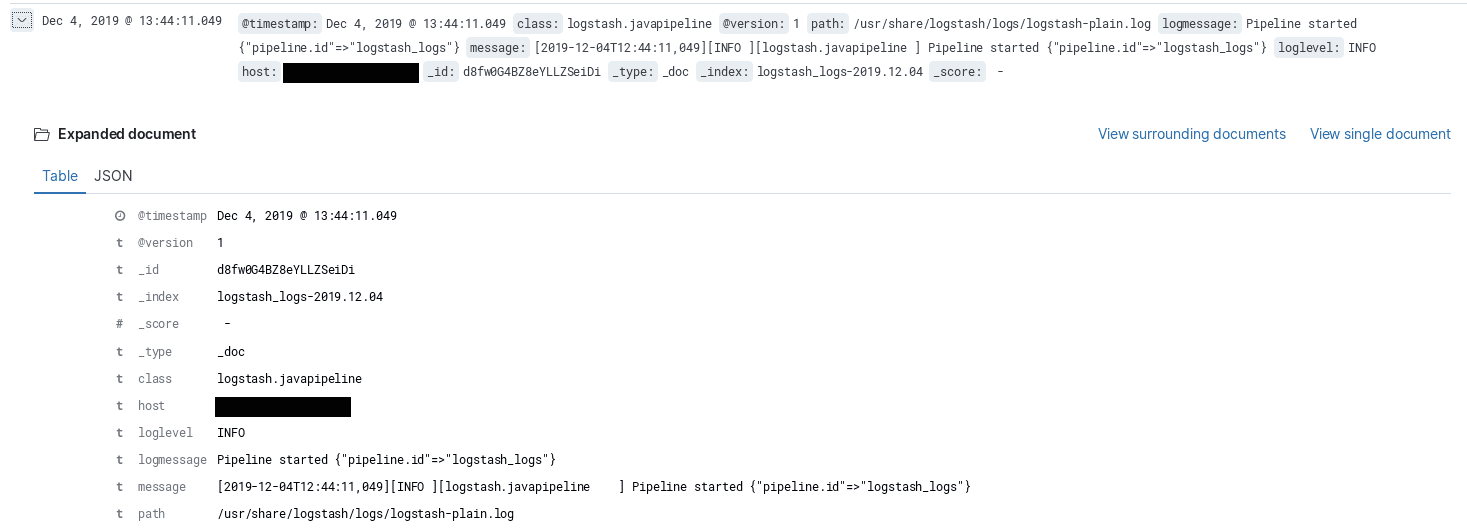
- A field named “host” is added by Logstash automatically. You can use this field to filter if you got multiple Logstash instances
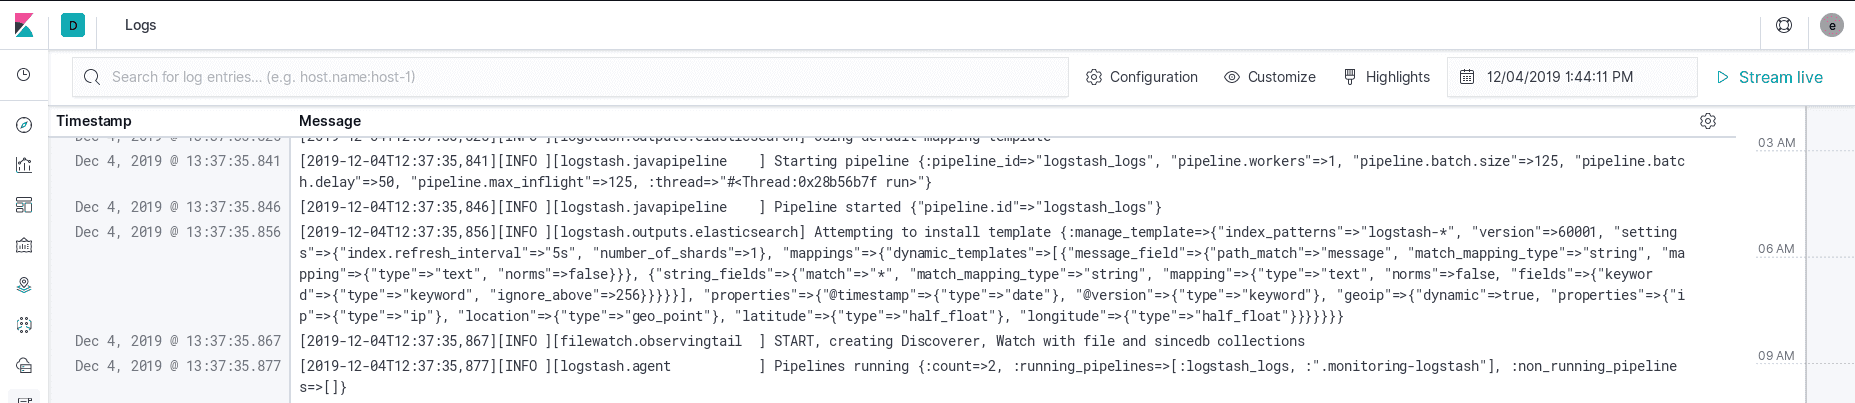
Results on Kibana
We can now use Kibana to see the logs of our Logstash instances.
We can use the “Discover” tab
Or the very convenient “Logs” tab. It’s like we are using tail -f on the file!