

 platform")
MLflow tutorial: an open source Machine Learning (ML) platform

Mar 23, 2020
Never miss our publications about Open Source, big data and distributed systems, low frequency of one email every two months.
Introduction and principles of MLflow
With increasingly cheaper computing power and storage and at the same time increasing data collection in all walks of life, many companies integrated Data Science into their workflow. In the beginning, the focus was on improving the predicting power of algorithms to enhance business performance. But now, that model development has matured and proven its utility, we are facing new challenges. How to share them outside of Data Science teams, knowing that final users are usually not the same people who developed them? How to assure reproducibility of the results, considering many different tools Data Scientists are using? And last but not least, how to bridge the skills gap between Data Engineers, Data Scientists and Operations teams, all of them playing very important but very different roles in deployment and maintenance of the models?
MLflow is a tool that helps addressing those issues. It enables Data Scientists to easily track the progress during the model development and tuning. It takes care of the packaging and deployment of models, no matter which framework or programming language was used to create it. In addition, MLflow provides a registry, where the models we want to keep or share can be safely stored and readily accessible. Abundant and good quality documentation can be found on MLflow’s official site. This tutorial was conceived on Arch Linux with Python 3.7.6 and MLflow 1.6.0.
First, let’s start with short definitions:
- Run is the individual execution of a code of a model. Each run will generate new folders and files, depending on what we decide to log.
- Experiment is a named group of runs.
MLflow consists of four modules:
- MLflow Tracking - keeps track of runs by saving metrics, parameters, tags and artifacts. It allows us to visualize and compare them in a browser in a user-friendly manner. Also, it creates different files with the description of the environment in which the run was executed (MLmodel, conda.yaml, model code).
- MLflow Project - is a format for packaging data science code in a reusable and reproducible way. It uses artifacts recorded at the tracking step.
- MLflow Model - is a standard format for packaging the models. The format defines a convention that lets you save a model in different flavors (e.g. Python function, R function, Scikit-learn, TensorFlow, Spark MLlib…) that can be understood by different downstream tools.
- MLflow Registry - is a centralized model store. It provides model lineage (which run produced the model), model versioning, stage transitions (for example from staging to production) and annotations.
Preparation of working environment
Install Miniconda with Python 3.x.
$ cd Downloads
$ sh Miniconda3-latest-Linux-x86_64.sh
Miniconda3 will now be installed into this location:
/home/petra/miniconda3
  - Press ENTER to confirm the location

...

Do you wish the installer to initialize Miniconda3 by running conda init? [yes|no]
[no] >>> yes
It is necessary to add Miniconda’s path to the environment $PATH variable. Go to ~/.profile and change NMP global to look something like this: export PATH=~/.nmp-global/bin:$PATH:~/miniconda3/bin.
Verify if Miniconda was added to the path and if it’s detected properly. Then, update it.
$ echo $PATH
/home/petra/miniconda3/envs/env_mlflow/bin:/home/petra/miniconda3/bin:
/home/petra/miniconda3/condabin:/home/petra/.npm-global/bin:
/usr/local/bin:/usr/local/sbin:/usr/bin:/home/petra/miniconda3/bin:
/usr/lib/jvm/default/bin:/usr/bin/site_perl:/usr/bin/vendor_perl:
/usr/bin/core_perl:/home/petra/miniconda3/bien

$ conda --version
conda 4.8.2

$ conda update conda
Create and activate a virtual environment named env_mlflow with Python 3.7.
$ conda create --name env_mlflow python=3.7
$ conda activate env_mlflow
Install all the packages needed for the tutorial to this environment. All pip-installed packages will reside in env_mlflow. Scikit-learn is Python machine learning framework and matplotlib is used for plotting. Postgresql, postgresql-contrib, postgresql-server-dev-all, gcc and psycopg2 are needed to set up PostgreSQL database and make it communicate with MLflow environment.
$ pip install mlflow
$ pip install sklearn
$ pip install matplotlib

$ sudo apt-get install postgresql postgresql-contrib postgresql-server-dev-all
$ sudo apt install gcc
$ pip install psycopg2
Downloading the example code
Many examples are available to illustrate the diverse functionalities of the MLflow framework. We will download a rather complete bundle, which you are welcome to explore on your own since we will cover only a fraction of it. Clone the repository.
$ git clone https://github.com/mlflow/mlflowSince we will be using sklearn_elasticnet_diabetes example, you can move to its directory.
$ cd ~/mlflow/examples/sklearn_elasticnet_diabetes/linuxIf we inspect the code in the train_diabetes.py, we see that MLflow is imported and used as any other Python library. Here, different logging functions are used (log_param, log_metric, log_artifact and sklearn.log_model) to record both inputs of the model, three different metrics, the model itself and a plot. For the moment, MLflow doesn’t offer any data registry, where we could save the training data. Anyhow, keeping the training dataset is important for reproducible experiments. Thus, we will save it as an artifact by adding the following lines of code to the end of the script.
data.to_csv('diabetes.txt', encoding = 'utf-8', index=False)
mlflow.log_artifact('diabetes.txt')
Setting up the Tracking server
We can log tracking data on the local file system or a server, to a directory or SQLAlchemy-compatible database. At the time of writing, the only way of storing models in a way that can be later saved in the Model Registry is with a database as a backend store. Below, we will explore two options - saving runs to a local drive and saving them on a local server with PostgreSQL database as a backend store. Therefore, only the latter example can be used to save the models in the Registry.
Saving runs to a local drive
If we are using MLflow for our personal needs and we are not planning to share models with other users, we can opt for storing the runs locally. This option is very easy to implement. It saves all of the generated files in the same location, which also simplifies the bookkeeping. If you run the train_diabetes.py as-is, the runs will get saved in a working directory in a newly created ./mlruns subdirectory. Let’s run the script with three different sets of arguments.
$ python train_diabetes.py 0.1 0.9
$ python train_diabetes.py 0.5 0.5
$ python train_diabetes.py 0.9 0.1
To inspect the logged data in a very user-friendly manner, stay in the same directory and run mlflow ui.
$ mlflow ui
[2020-03-04 15:14:57 +0100] [15651] [INFO] Starting gunicorn 20.0.4
[2020-03-04 15:14:57 +0100] [15651] [INFO] Listening at: http://127.0.0.1:5000 (15651)
Copy the displayed URL in your web browser and look at the results. You will see a table with many details about the run, including parameters passed at the execution and logged metrics. Since we did not name the experiment, the runs are being saved under ‘Default’ tab.
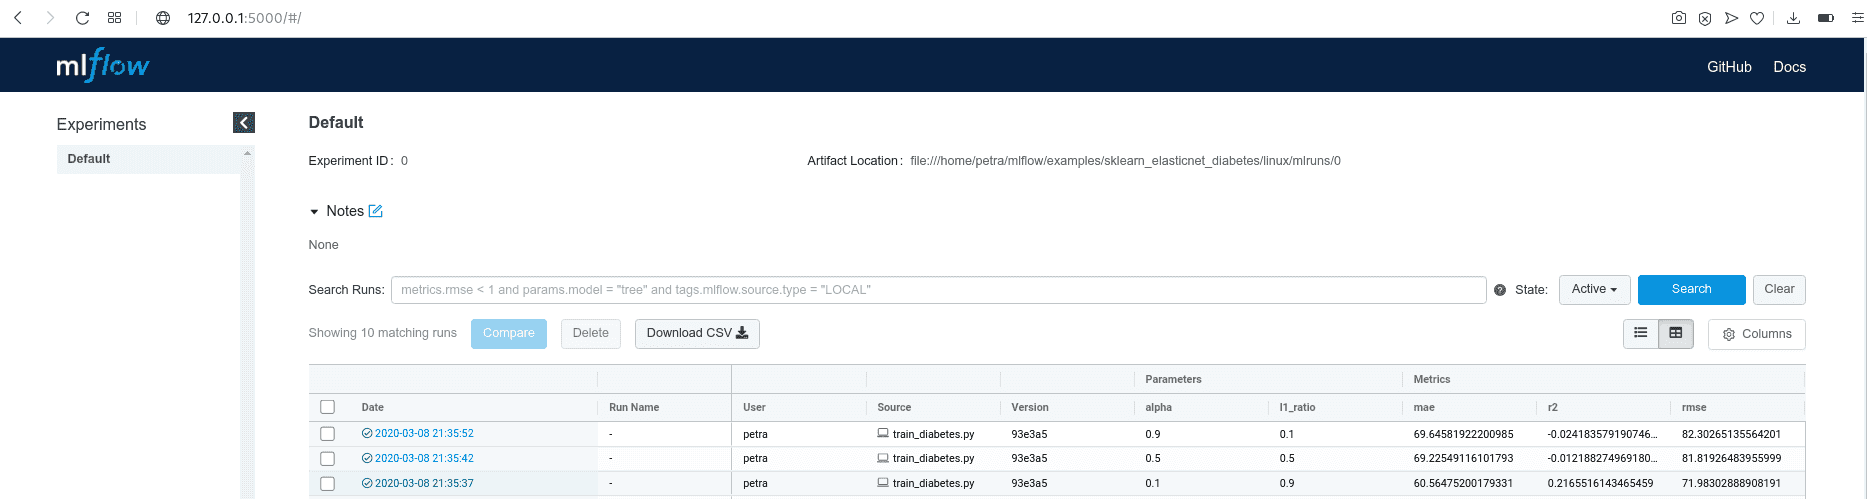
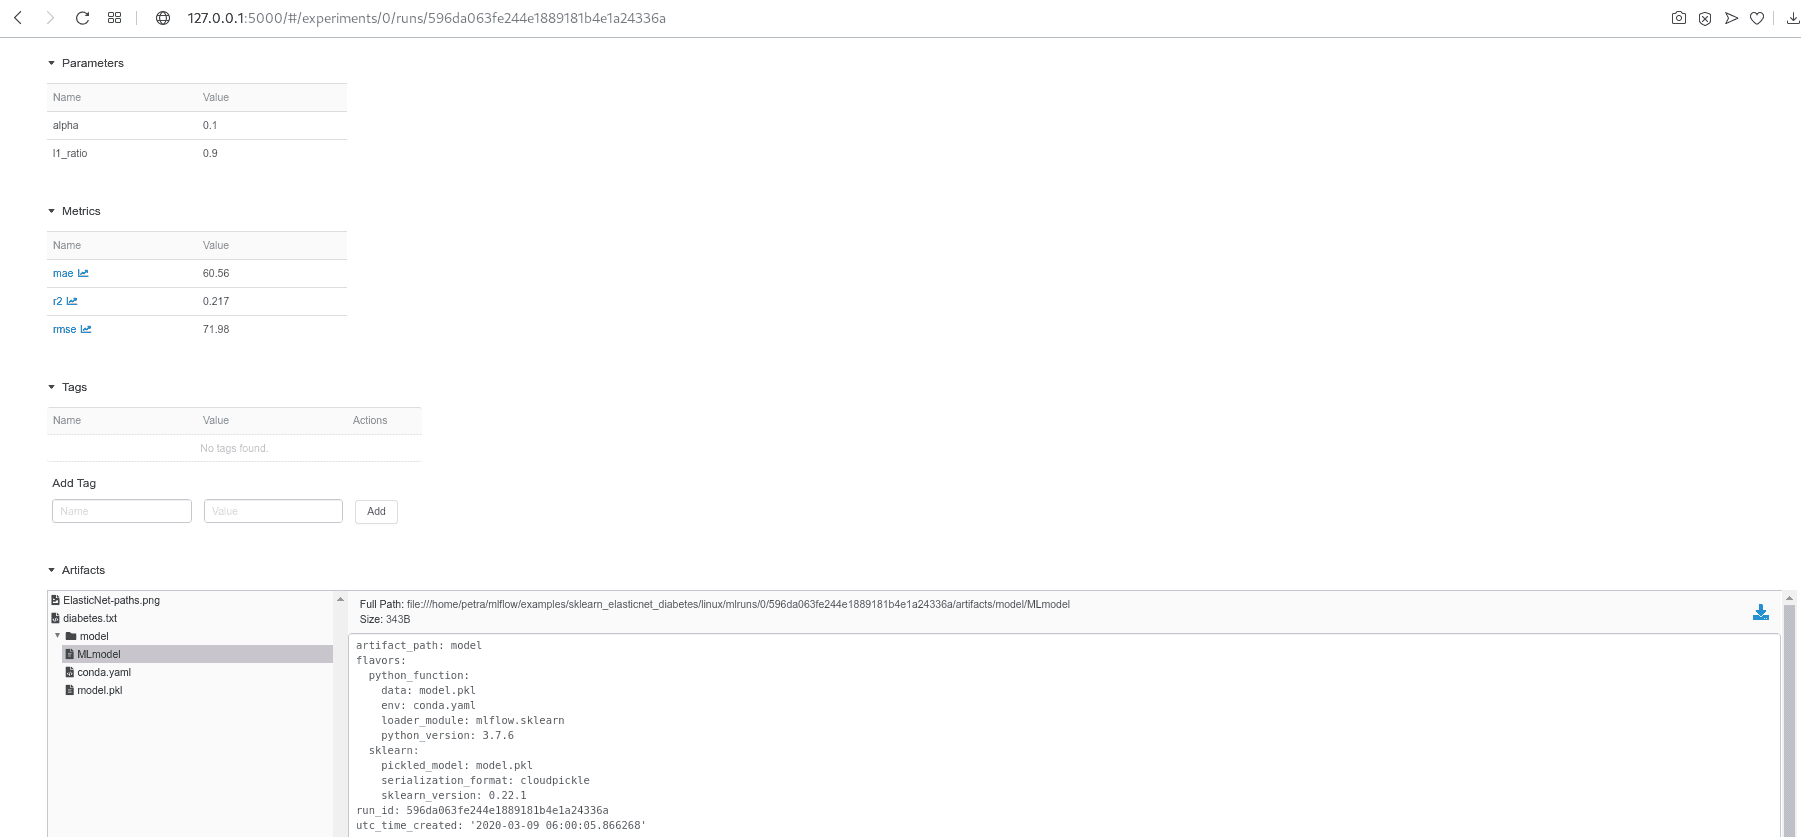
By clicking on the Date of a run, you can see all the details about this run, examine the artifacts and visualize the behavior of your metrics.
If you prefer to save runs to a designated location, you can specify it at the beginning of the program as follows:
import mlflow
import mlflow.sklearn
mlflow.set_tracking_uri('file:/home/petra/mlrun_store')
NOTE: Specified folder needs to be created during execution when referenced for the first time. If it is created upfront, the script terminates with the following error message: mlflow.exceptions.MlflowException: Could not find experiment with ID 0.
To display the recorded data in the browser in this case, you need to pass the address of your storage location to mlflow ui.
$ mlflow ui --backend-store-uri file:/home/petra/mlrun_store \
          --default-artifact-root file:/home/petra/mlrun_store \
          --host 0.0.0.0 \
          --port 5000
Even though the call returns WARNING:root:Malformed experiment 'mlruns'. Detailed error Yaml file '/home/petra/mlrun_store/mlruns/meta.yaml' does not exist. it works correctly and it continues to record and display new runs.
After the tutorial you will probably want to stop MLflow modules and liberate the ports. First, you can list the ports in use with ss -tuna. Then, for example, to kill a process on a port 5000, execute a command kill $(lsof -t -i :5000).
Saving runs to a local server
Since we decided to use PostgreSQL database as a backend store, we first need to set it up.
$ sudo -U postgres -i
# Create new user: mlflow_user
[postgres@archlinux ~]$ createuser --interactive -P
Enter name of role to add: mlflow_user
Enter password for new role: mlflow
Enter it again: mlflow
Shall the new role be a superuser? (y/n) n
Shall the new role be allowed to create databases? (y/n) n
Shall the new role be allowed to create more new roles? (y/n) n
# Create database mlflow_bd owned by mlflow_user
$ createdb -O mlflow_user mlflow_db
Local folder for the artifacts created during runs:
$ mkdir ~/artifact_rootThe difference with local storage, where everything is stored in one directory, is that in this case we have two store locations: --backend-store-uri for everything except artifacts and --default-artifact-root for artifacts only. Database needs to be encoded as dialect+driver://username:password@host:port/database.
Launch tracking server as the local server:
$ mlflow server --backend-store-uri postgresql://mlflow_user@localhost/mlflow_db \
                --default-artifact-root file:/home/petra/artifact_root \
                --host 0.0.0.0 \
                --port 5000

[2020-03-04 16:52:18 +0100] [22268] [INFO] Starting gunicorn 20.0.4
[2020-03-04 16:52:18 +0100] [22268] [INFO] Listening at: http://0.0.0.0:5000 (22268)
Set tracking URI at the beginning of your program, with the same host:port as you used to configure the mlflow server:
import mlflow
import mlflow.sklearn
mlflow.set_tracking_uri('http://0.0.0.0:5000')
Do a couple of runs as before and look them up in your browser. We can also examine mlflow_db. Connect to the database and list all the tables.
$ psql -d mlflow_db -U mlflow_user
mlflow_db=> \d+

                                     List of relations
 Schema |             Name              |   Type   |    Owner    |    Size    | Description
--------+-------------------------------+----------+-------------+------------+-------------
 public | alembic_version               | table    | mlflow_user | 8192 bytes |
 public | experiment_tags               | table    | mlflow_user | 8192 bytes |
 public | experiments                   | table    | mlflow_user | 16 kB      |
 public | experiments_experiment_id_seq | sequence | mlflow_user | 8192 bytes |
 public | latest_metrics                | table    | mlflow_user | 8192 bytes |
 public | metrics                       | table    | mlflow_user | 8192 bytes |
 public | model_versions                | table    | mlflow_user | 16 kB      |
 public | params                        | table    | mlflow_user | 16 kB      |
 public | registered_models             | table    | mlflow_user | 16 kB      |
 public | runs                          | table    | mlflow_user | 16 kB      |
 public | tags                          | table    | mlflow_user | 16 kB      |
(11 rows)
Select a table and display its content. To exit the view, type :q.
mlflow_db=> select * from metrics;

key  |         value          |   timestamp   |             run_uuid             | step | is_nan
------+------------------------+---------------+----------------------------------+------+--------
rmse |      78.59248628523486 | 1583337265410 | a365d280a43f4af89378fc608f2bba0f |    0 | f
r2   |    0.06607454600721252 | 1583337265421 | a365d280a43f4af89378fc608f2bba0f |    0 | f
mae  |      66.30996047256438 | 1583337265430 | a365d280a43f4af89378fc608f2bba0f |    0 | f
rmse |      71.98302888908191 | 1583401098173 | a2491ceec4c64084a0ae8a07ff8e299a |    0 | f
r2   |     0.2165516143465459 | 1583401098267 | a2491ceec4c64084a0ae8a07ff8e299a |    0 | f
mae | 60.56475200179331 | 1583401098338 | a2491ceec4c64084a0ae8a07ff8e299a | 0 | fmlflow_db=> exitIf you use the tracking server the way we just did, you will need to restart it after each reboot of your computer, since the mlflow server will be stopped. As an alternative, we will create a resilient service, which will automatically restart after each disconnection or restart of the system. It will be running as a background service.
First, we need to create a folder for standard output and standard error logs, otherwise, you will encounter 209/STDOUT error.
$ mkdir ~/mlrunsCreate a file with the name mlflow-tracking.service and copy the content below. Adapt the paths accordingly.
$ sudo vim /etc/systemd/system/mlflow-tracking.service[Unit]
Description=MLflow tracking server
After=network.target
[Service]
Restart=on-failure
RestartSec=30
StandardOutput=file:/home/petra/mlruns/stdout.log
StandardError=file:/home/petra/mlruns/stderr.log
ExecStart=/bin/bash -c 'PATH=/home/petra/miniconda3/envs/env_mlflow/bin/:$PATH exec mlflow server --backend-store-uri postgresql://mlflow_user@localhost/mlflow_db --default-artifact-root file:/home/petra/artifact_root --host 0.0.0.0 --port 5000'
[Install]
WantedBy=multi-user.targetThis service must be enabled and started.
# Reload unit files
$ sudo systemctl daemon-reload
$ sudo systemctl enable mlflow-tracking
$ sudo systemctl start mlflow-tracking
# Check if it is working
$ sudo systemctl status mlflow-tracking
You should see the service active and running. When you want to stop it, use sudo systemctl stop mlflow-tracking.
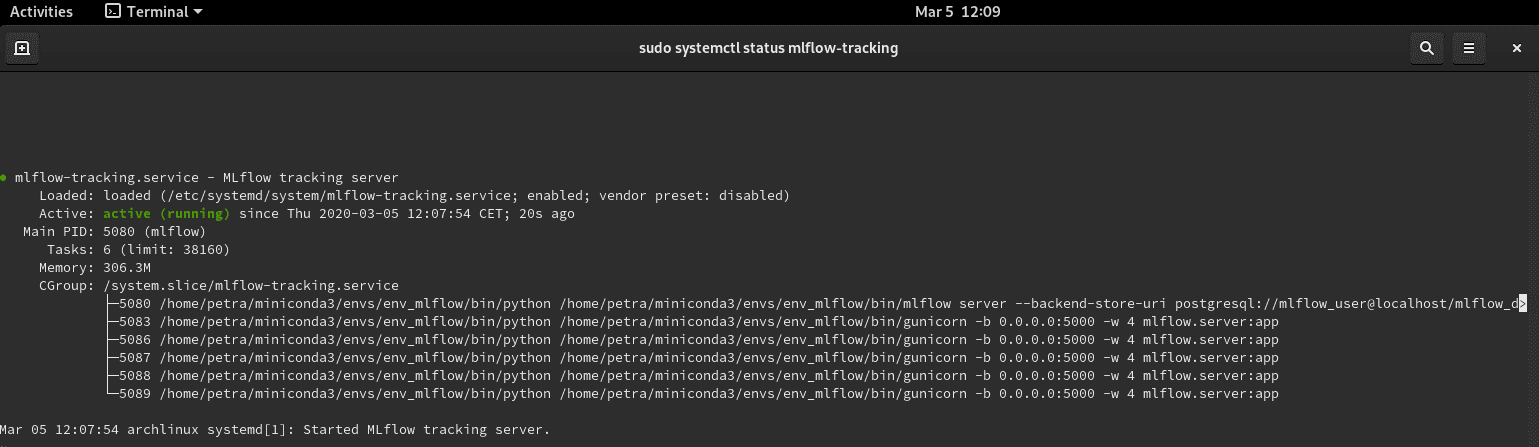
Restart the terminal to re-read the .service files. Re-activate the virtual environment env_mlflow. Re-run python train_diabetes.py. To see the logged data, go to http://localhost:5000 and refresh the page if needed.
After testing several combinations of input parameters of the model, we can select the most performant one (e.g. largest r2) from the UI. At this point, we need to decide what the destiny of the model will be. If we want to put it on disposition to other users, we can package and deploy it. If we just want to save it for later use, we can put it in the repository. Both cases are described below.
Packaging a model
MLflow Models module takes care of packaging of our machine learning model. If we look in the artifact-root directory, we see that for each run exists a subdirectory /model, with conda.yaml, MLmodel and model.pkl files. MLmodel contains information about the flavor of the model, a reference to its creation environment (conda.yaml), its persistent representation (model.pkl) and additional run-time details. With this information, we can reproducibly run our model elsewhere.
Currently supported flavors are: Python function, R function, H2O, Keras, MLeap, PyTorch, Scikit-learn, Spark MLlib, TensorFlow, ONNX, MXNet Gluon, XGBoost and LightGBM.
Serving a model
MLflow offers several options for serving a model. We can deploy it locally, on Amazon SageMaker, Microsoft Azure ML or we can export it as an Apache Spark UDF to be run on a Spark cluster. Not all deployment methods are available for all model flavors. When we decided which model we want to deploy, we need to find the location of the artifacts. We get it by clicking on the Artifacts/model in the UI and copying Full Path next to Register Model or Download button (look at the image above). As with the tracking server, we can serve a model temporarily or as a resilient service.
$ mlflow models serve \
-m file:/home/petra/artifact_root/0/6a01bc26500c48b589bb993153fb92a3/artifacts/model \
-h 0.0.0.0 \
-p 8003
You can query the model with new observations and get predictions.
$ curl --request POST http://0.0.0.0:8003/invocations \
       --header "Content-Type:application/json; format=pandas-split" \
       --data '{
    "columns":["age", "sex", "bmi", "bp", "s1", "s2", "s3", "s4", "s5", "s6"],
    "data":[[0.01628, -0.04464, 0.00133, 0.00810, 0.00531, 0.01089, 0.03023, -0.03949, -0.04542, 0.03205]]
  }'
Like before, we would like to have a resilient service. Therefore, we need to create a new .service file, this time with information about the model.
$ sudo vim /etc/systemd/system/mlflow-production.serviceThe content should be as following:
[Unit]
Description=MLFlow model in production
After=network.target

[Service]
Restart=on-failure
RestartSec=30
StandardOutput=file:/home/petra/mlruns/stdout.log
StandardError=file:/home/petra/mlruns/stderr.log
Environment=MLFLOW_TRACKING_URI=http://0.0.0.0:8001
Environment=MLFLOW_CONDA_HOME=/home/petra/miniconda3
ExecStart=/bin/bash -c 'PATH=/home/petra/miniconda3/envs/env_mlflow/bin/:$PATH exec mlflow models serve -m file:/home/petra/artifact_root/0/6a01bc26500c48b589bb993153fb92a3/artifacts/model -h 0.0.0.0 -p 8001'

[Install]
WantedBy=multi-user.target
$ sudo systemctl daemon-reload
$ sudo systemctl enable mlflow-production
$ sudo systemctl start mlflow-production
$ sudo systemctl status mlflow-productionRestart the terminal and query the model.
$ curl --request POST http://0.0.0.0:8001/invocations \
       --header "Content-Type:application/json; format=pandas-split" \
       --data '{
    "columns":["age", "sex", "bmi", "bp", "s1", "s2", "s3", "s4", "s5", "s6"],
    "data":[[0.01628, -0.04464, 0.00133, 0.00810, 0.00531, 0.01089, 0.03023, -0.03949, -0.04542, 0.03205]]
  }'
As you might notice, the env_mlflow does not need to be activated anymore, since the deployed model creates its proper environment. Another thing worth mentioning is that now, API is the only way to interact with the model. Even though tracking URIs are still in the form of HTTP addresses, we don’t have access to them in the browser anymore.
Saving a model to the registry
Maybe the goal of a Data Science project is not to publish a model in production. However, we would like to keep the current best version somewhere safe, where we could easily recuperate it when the time comes. In this case, saving it to the MLflow Registry is the easiest option. It is extremely fast since it only requires one click. Once registered, other people can access it, so it is a comfortable way of sharing the code for collaborations or reviews. Also, a model can be staged or publish directly from the registry.
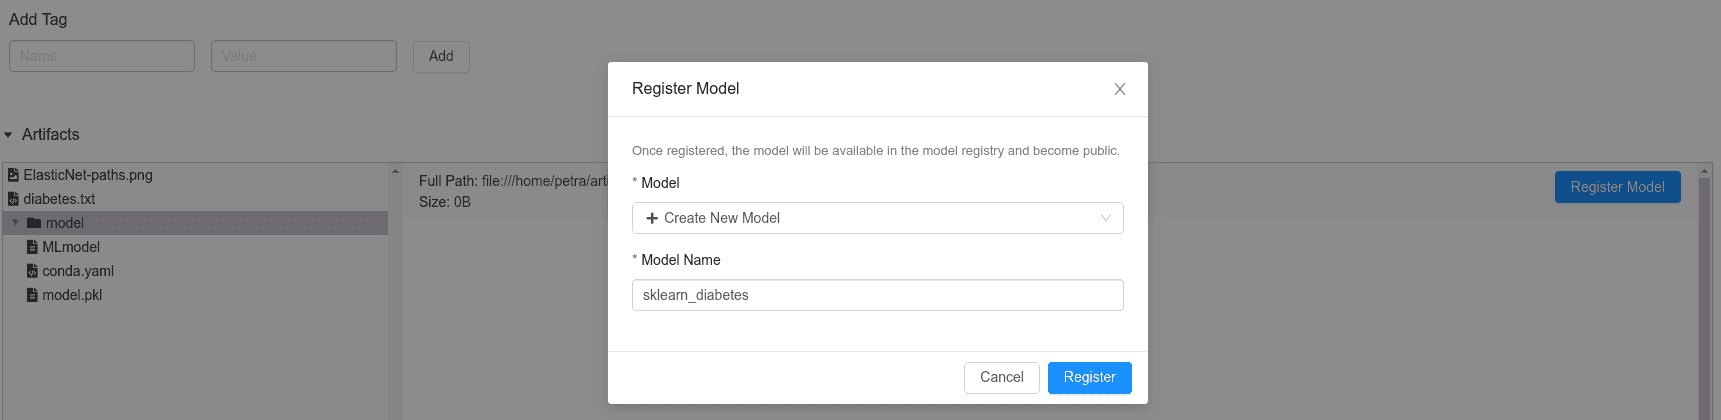
You can find the registry on http://0.0.0.0:5000/#/models/ or directly in the mlflow_db in the table registered_models.
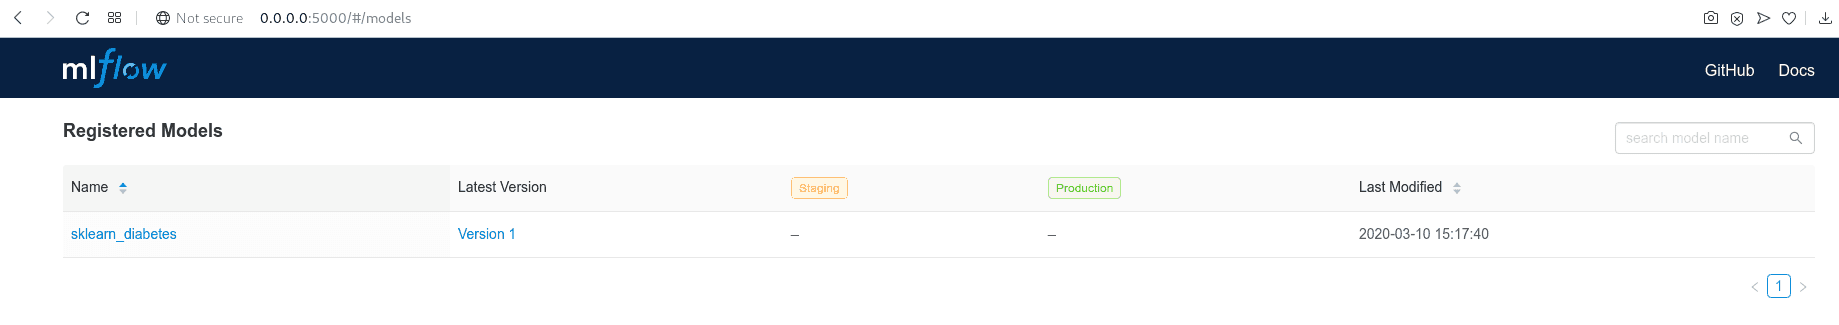
mlflow_db=> select * from registered_models;
           name            | creation_time | last_updated_time | description
---------------------------+---------------+-------------------+-------------
 sklearn_diabetes          | 1583408657063 |     1583419663533 |
(1 row)
NOTE: This option will work only if you use a database as a backend store. At the time of writing, the file-store was not supported and it threw an INTERNAL_SERVER_ERROR.
Conclusion
In this article we took the first steps towards reproducible Data Science and model deployment with MLflow. We looked at different ways of using its open source version. We see how we can track experiments in a local directory and the PostgreSQL database, we used UI in a browser for easier overview and we saved the most promising model in a Registry. In part 2 we will explore Databricks Community Edition and managed version of MLflow and in part 3 Azure-hosted Databricks, with a more complete Data Science project.
References
https://www.mlflow.org/docs/latest/tutorials-and-examples/index.html
https://www.youtube.com/watch?v=6z0_n8kxh-g
https://thegurus.tech/posts/2019/06/mlflow-production-setup/
http://postgresguide.com/utilities/psql.html
